
Ventilatory Thresholds
What are Ventilatory Thresholds? And how can I apply them to training?
Establishing Training Thresholds – A key to success in competitive Nordic Skiing
By Tom Cuddy
A common pitfall for endurance athletes is lack of structure when planning training intensity. Even with the plethora of training tools like heart rate monitors and other fitness trackers, there is often a disconnect with intended intensity and the actual training intensity. This mismatch in intensity distribution can lead to serious disappoint when race day shows up. Simply put, many skiers end up going too hard on their easy days and too easy on hard days. Undoubtedly, there is a close relationship between these two types of training. For instance, ramping up intensity too often on training days that are intended to be easy leads to poor recovery. Furthermore, this poor recovery results in worthless high intensity days where you are better off just staying home.
The question is: What actually signifies an easy day versus a hard day?
With the plethora of training tools like heart rate monitors and other activity trackers, one would think that it should be simple to understand how hard they are pushing themselves. However, when looking at training data, it instead looks like some sort of cryptic code that shows up when your computer crashes.
The following article is going to cover the use of Ventilatory Thresholds for establishing training intensity. These thresholds, VT1 and VT2, are used to establish a 3-zone heart rate model, known as the Polarized Training Model. For the sake of your attention span, I am going to post a follow-up article comparing the Polarized model with your typical 5-zone heart rate model soon.
Ventilatory thresholds represent important physiological changes in the way we response to different exercise intensities. These sudden changes, known as thresholds, are reflected by changes in the way we breathe. During exercise, we consume oxygen (O2) and produce carbon dioxide (CO2) at faster rates relative to how hard the intensity is. To accommodate for this increased O2and CO2exchange, our lungs need to increase ventilation.
This increase in ventilation primarily occurs through an increase in tidal volume, which is the volume of air inhaled and exhaled per breath. When we begin exercising at near-maximal or maximal intensities, our breathing frequencydisproportionately rises in relation to the amount of oxygen we are consuming. Transitioning from rest to maximal intensity, breathing frequency may increase from 12 to 15 breaths at rest to 35 to 45 breaths per minute (McArdle, Katch, & Katch 2010).
Before we dive into thresholds and what they represent, let’s review some basics of energy metabolism…
During low exercise intensities (i.e. <60% of VO2max), fats are our primary fuel source for muscle contraction. Fats represent a massive fuel source in our body when compared to the stored form of carbohydrates, known as glycogen. In normal-weight individuals, body fat provides approximately 30,000-100,000 calories whereas muscle glycogen provides only 1,400-2,000 calories. In a perfect world, we could instantly tap into this abundant fuel source and exercise for days on end at any intensity. Unfortunately, this is not the case.
When using fats as an energy substrate during low-intensity exercise, we recruit muscle fibers that have greater oxidative capacities. These fibers, known as slow-twitch type I muscle fibers, are fatigue resistant and efficient at burning fats due to their greater mitochondrial density. At this exercise intensity, the oxygen delivery system is effective at supplying the oxygen demands of the activity. However, as exercise intensity increases to the point at which the oxygen demand exceeds the capacity oxygen delivery system,two important changes in metabolism occur. The breakdown of fats into energy for muscle contraction requires a series of reactions that simply take too long to keep up with the metabolic demand of higher intensity activity. To keep up with this greater metabolic demand:
1. There is a greater reliance on glycogen as a fuel source
2. There is a shift in muscle fiber recruitment – increased recruitment of less oxidative, fast twitch, type II muscle fibers.
Before this shift, small amounts of glycogen are used as an energy substrate for muscle contraction. The breakdown of glycogen, a process known as glycogenolysis, results in the release of hydrogen ions (H+) and lactate. Too much H+ accumulation and the muscle cell begins to function improperly. Essentially, H+ accumulation represents metabolic acidosis and is thought to be a large contributing factor to fatigue. Therefore, lactate binds to the H+ and is cleared out of the muscle cell it was produced in and is shuttled into a neighboring cell. Typically, lactate is shuttled to a type I muscle fiber within the muscle bed. Here, lactate enters the mitochondria and is used as a fuel source to produce energy!
This process, termed the Lactate Shuttle, also brings along the H+ into the mitochondria so that O2can oxidize H+ and convert it into H2O. Recycling lactate and buffering H+ is essential for steady-state activity to ensure muscle cells maintain homeostasis. Essentially, when the energy demand of muscle contraction is met by aerobic pathways in the mitochondria, there is no H+ accumulation and subsequent metabolic acidosis (Robergs, 2004).
The First Ventilatory Threshold.
[A.k.a. the moment you can no longer hold conversation pace]
When there is a greater reliance on glycogen and an increased recruitment of fast-twitch, type II muscle fibers, lactate and H+ accumulate faster than they can be shuttled and oxidized. The lactate and H+ then spill into the bloodstream and the H+ must be buffered and converted into CO2. This onset of blood lactate appearance in the blood and buildup of CO2coincides with the first ventilatory threshold (VT1). For those of you who are familiar with lactate measurements, VT1 would occur at ~2.0 mmol/L.
Leading up to VT1, ventilation increases linearly by increasing tidal volume. Past VT1, however, ventilation rates begin to increase exponentially and does so by increasing breathing frequency in addition to tidal volume. This increase in breathing frequency is triggered for a variety of reasons.
- When CO2accumulates in the blood as a result of buffering metabolic acid build-up, increasing breathing rate aids in getting rid of extra CO2.
- Increasing breathing frequency increases the driving force of oxygen into the lungs as a effort to supply more oxygen to the system
- At this level of exercise intensity, the release of the catecholamines (epinephrine and norepinephrine) from the adrenal gland occurs.
The release of catecholamines directly and indirectly increases the rate of ventilation. Directly, catecholamines promotes the distribution of blood flow into the lungs and increases breathing rate in an effort to deliver more oxygen to working muscle. Indirectly, the release of catecholamines affect what fuel sources we use during exercise. Above an exercise intensity of ~60%, there is a massive release of epinephrine from the adrenal gland. The release of this ‘fight-or-flight’ hormone stimulates glycogenolysis to support the increase in exercise intensity. As previously mentioned, the more we rely on glycogen as a fuel source, the more we need to buffer metabolic acidosis and exhale CO2.
Let’s look at some VO2max data to better understand how to find VT1 and what it represents
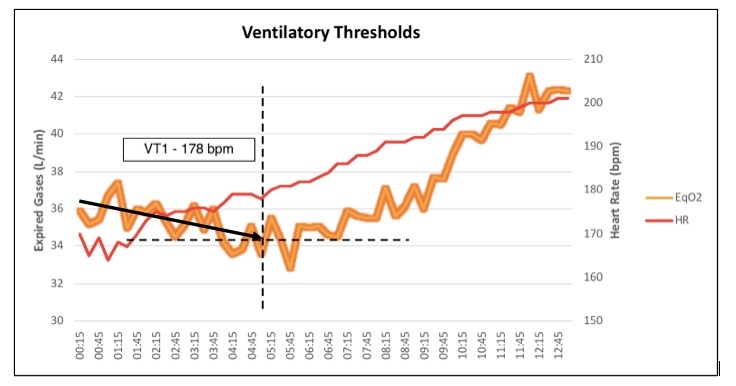
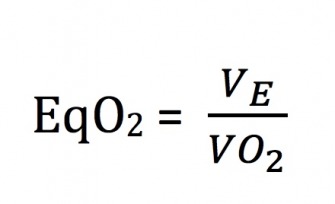
The orange line from this graph is called the ventilatory equivalent of oxygen consumption (EqO2). This line can seem to be hectic – but don’t freak out! The important part is to look for general trends in this line. Simply by dividing minute ventilation (VE), the volume of air inhaled and exhaled per minute, by the volume of oxygen consumption (VO2), we can understand physiological turn points as reflected by ventilation.
During this VO2max test, we increased exercise intensity each minute by adding 1% grade while maintaining the same speed of 6 mph. When we think of EqO2 as a ratio, we look at breathing rates relative to the amount of O2 we are consuming to understand what is happening throughout the physiological systems performing. As you can see, the ratio of EqO2decreases for the first 5 minutes of the test. I’ve drawn a black arrow on the graph to represent the general trend of this value. For this number to decrease, the denominator must be increasing at a faster rate than the numerator (remember- VE will still be increasing! – but VCO2 will be increasing at a faster rate).
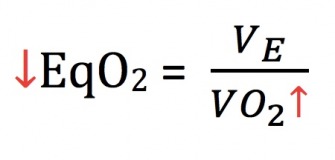
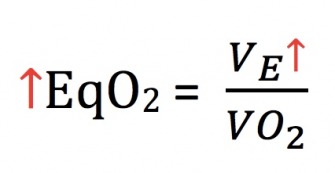
This means that there was a higher degree of oxygen being extracted and consumed by working muscles. Essentially, this individual was becoming more and more efficient in transporting oxygen to working muscles. Then, immediately after a low point, the trend line follows a steady increase, meaning that ventilation begins to exceed the rate of oxygen consumption. So as this number increases as shown below, it indicates that the individual is losing efficiency due to the need to breathe harder to consume the same amount of oxygen.
This point in deviation, which is identified by the lowest EqO2ratio, is VT1. To provide some context, in well-trained individuals, VT1 is approximately the highest intensity that can be sustained for 1-2 hours of exercise. In addition, the intensity of VT1 is sometimes referred to as marathon pace in elite level runners. The exercise intensity someone can tolerate at VT1 indicates their efficiency of using type 1 muscle fibers and how well they can utilize fats as an energy substrate. Typically, VT1 occurs when an individual is burning approximately 50% fats and 50% carbohydrates. However, there is a lot of variability between individuals in substrate utilization depending of things like genetics, diet, and training.
When applying VT1 to training, you simply identify the heart rate that VT1 occurs at. Another easy way to tell if you are below VT1 is if you can hold a conversation while exercising. The moment that it becomes difficult to hold a conversation indicates that you need to increase your breathing frequency for the reasons mentioned above. When we talk about “aerobic base training,” we are referring to the training that targets the physiological systems working before this threshold occurs.
For this particular Nordic skier, her VT1 occurred at 178 bpm, which was 88% of her HRmax. In terms of VO2, this threshold occurred at 75% of her VO2max. Training at or below 178 bpm would represent the recommended highest intensity she should work at for all of her low intensity training. This individual is a prime example of why using heart rate percentages based on a predicted HR max isn’t always the most effective method of establishing intensity.
From a physiological standpoint, VT1 represents an intensity that most people think of as somewhere between zone 2 and zone 3. However, for this individual, her VT1 occurred at an intensity that would be considered to be in zone 4 in a 5-zone model. In a later post, I will go into using training zones based on VT thresholds, a method known as Polarized Training. Now, let’s go into the second ventilatory threshold (VT2):
The 2ndVentilatory Threshold
[When exercise starts to suck]
Progressing exercise intensity past VT1 into an exercise intensity between VT1 and VT2, is an exercise intensity comparable to what is known as zone 3. This intensity, sometimes referred to as ‘tempo-training,’ is the intensity that is right below lactate threshold. A well-trained individual will likely be able to maintain this intensity for approximately 1 hour.
Lactate threshold is a physiological moment where lactate begins to accumulate in the blood at an exponential rate. If you conducted a lactate threshold test, you would exercise at progressively harder intensities and measure blood lactate every 1-3 minutes. For instance, if you were doing a Lactate Threshold test on the bike, you might ride for 3 minute stages and increase intensity by 30 W and take a lactate measurement at the end of each stage. The Idea is to target the specific intensity required to cause an exponential increase in lactate accumulation.
Typically, the exercise intensity that elicits a lactate measurement of 4 mmol/L indicates that someone has reached their threshold. At lactate threshold, the muscle cells are heavily relying on anaerobic glycolysis and glycogenolysis. This means that the intensity demands of the exercise requires an immediate fuel source. Since the majority of glycogen is stored within the muscle and doesn’t have to travel too far, it is the preferred fuel source!
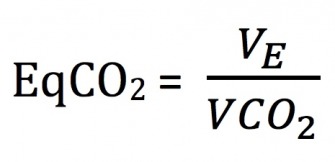
As exercise intensity progresses, the production of lactate and the release of H+ within the muscle cell increases. This in turn leads to a dramatic increase in the amount of CO2being produced. Similar to the ventilatory equivalent of O2, we are also interested in the ventilatory equivalent of CO2. This value is found by dividing VEby VCO2.
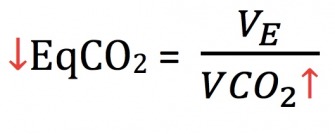
Based on the graph below (from the same VO2max test), the blue line represents EqCO2. As you can see, the trendline shows that during the first 7:30 mins of the test, EqCO2decreases until it reaches a low point. This trend indicates that the rate of CO2production was increasing at a faster rate than the rate of minute ventilation. From this information, we know that the rate of ventilation was sufficient at getting rid of the CO2 being produced from the buffering system.
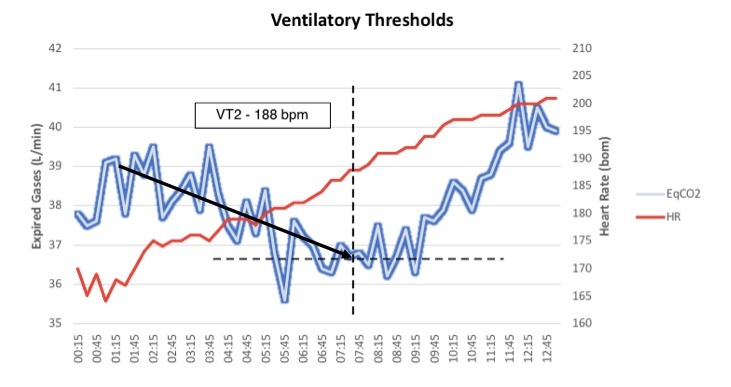
After this low point, EqCO2begins to exponentially increase. This deviation, identified as the 2ndventilatory threshold (VT2), represents a sudden change in breathing and energy metabolism. VT2 occurs at a similar physiological moment to lactate threshold. EqCO2starts trending upward due to a sudden dramatic increase in ventilation. This excessive breathing rate, termed hyperventilation, indicates that the physiological systems tasked with buffering metabolic acidosis have failed at maintaining homeostasis and have allowed an exponential accumulation of blood lactate and metabolic acidosis. Therefore, hyperventilating becomes a compensatory mechanism to exhale CO2that has been produced from energy metabolism.
This disproportionate increase in ventilation usually occurs as someone begins to use 100% carbohydrates and 0% fat for fuel. However, similar to VT1, great variability exists in substrate utilization due to differences in physiology. For instance, some elite Nordic athletes I have tested have incredible fat burning capabilities. During one test, I observed an individual still getting 30% of their energy from fats at VT2!
During the test I used for the above graphs, VT2 occurred at 188 bpm, which was 93% of her HRmax. For VO2, VT2 occurred at and 88% of her VO2max. This result demonstrates that she has very high levels of fitness. The greater VT2 is relative to VO2max means that an individual can exercise at very rigorous intensities before their buffering systems fail!
Rational for Establishing Ventilatory Thresholds:
Knowing these HR ranges were very effective for planning out this skier’s training intensities. With this data, I was able to consult with her and her coaches regarding specific heart rate zones to target specific parameters of her physiology. For her high intensity interval work, she needed to be exercising at or above 188 bpm so that she could train her body to tolerate high levels of lactate accumulation and H+ build up. By training at this intensity, she would improve her ability to shuttle lactate to type I muscle fibers and use it as a fuel source. In addition, by causing a build up of H+, her buffering systems are cued to adapt so that the next time she exercises at this intensity, she will be more efficient at neutralizing the acidity.
If she had followed a 5-zone heart rate model where she aimed at exercising at zone 4 (80% of her predicted HR max) for interval work, she would be aiming for an intensity corresponding to 163 bpm. Exercising 25 bpm below what her true physiological target is certainlywould not have trained her ability to shuttle lactate and buffer metabolic acidosis!
Take-aways
- Establish your thresholds! Sign up for VO2max test or a Lactate Threshold test to better understand your own personal exercise intensities & how to use them
- There is a lot more information you can obtain from a VO2max test than just your “VO2max score.” Talk to your local physiologist, ask them questions.. –“Hey! How much do I rely on fats as an energy substrate while I am exercising at my 2ndventilatory threshold?!?!”
- Heart rate monitors are great training tools, but the HR zones you think your working at might not represent your individual physiology
- After you get tested, start thinking about your breathing in response to exercise. Are you able to hold a conversation on your low intensity days? Is your training partner able to hold a conversation while you gasp for air? Or vice versa? Communicate this! Let them know you want to improve your ability to shuttle lactate!