
TRaining periodization : Monitoring Recovery
By Sarah Willis, PhD

The different phases of the above test have multiple intentions: the resting heart rate provides indication of general fitness and overall health (Reimers et al., 2018), the standing/orthostatic heart rate gives further insight to general fitness and also neural recovery, a modified Ruffier Index (test value) offers a fatigue and recovery marker to adjust exercise/training, and post-exercise resting heart rate gives insight to the recovery rate and active recovery response. Furthermore, the rate in which our body recovers from exercise (even if monitored after light squat exercise during lying rest) indicates the recovery of the parasympathetic nervous system (PNS), an autonomic control system of our body which is responsible for regulating our resting state by reducing both heart rate and respiration frequency as well as improving digestion. Research shows that reactivation of the parasympathetic nervous system begins within the 1stminute after stopping exercise and further continues for about 10 minutes after exercise (Michael et al., 2017). This reactivation of the PNS is dependent on exercise intensity and involves the combination of gradual metabolite clearance (decreased metaboreflex input), reduction of circulating catecholamines (hormones such as dopamine, adrenaline, and noradrenaline which are released due to emotional or physical stress from “fight or flight” response), and possible alterations of thermoregulatory factors such as blood flow redistribution (Michael et al., 2017). Therefore, the rate of recovery (measured by heart rate) post-exercise signifies the body’s ability to return to a homeostatic and balanced resting state. In general, the quicker the slowing of heart rate occurs after exercise, the less fatigue present in the body.
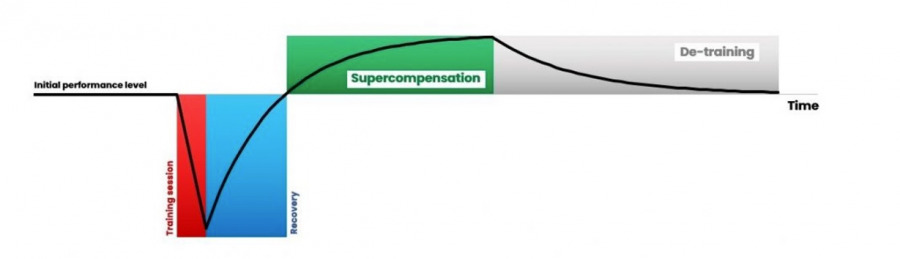
It is well-known that recovery is an important part of the training process. So important in fact that many of the top athletes could agree that it is a commonly overlooked and undermined area where many of us can place a greater focus to improve our performance. The general process of training includes a loading or overloading (stressing of the body with an exercise and/or environmental stimulus), followed by rest, and subsequently a supercompensation. By using periodization (a wave-like pattern with varied cycles focusing on different amounts of intensity and volume) within training plans, we can develop adaptations and improve performance. The training is therefore periodized with different phases and mesocycles depending on focused competitions and therefore also the recovery becomes crucial in this process.
(Image from theathleteblog.com)
The question and sometimes tricky part is for coaches and athletes to understand the timing of the adaptations and the supercompensation as far as when that might occur. This is dependent on several factors primarily including the intensity of exercise but also the mode of exercise and fatigue level, etc. Below is an illustration for timing of the supercompensation dependent on training type and intensity.
Image based on Olbrecht, unpublished data and obtained from lactate.com
As recovery is crucial for our body in order to facilitate adaptations, it is of interest to find practical ways in which we can monitor this process. By understanding signals and feelings in our body, we as coaches and athletes can make adjustments in daily training (for example, the ‘go ahead’ to perform an intended interval session or rather to choose an easy distance session to promote more recovery time, to adjust the number of intervals in the session or number of training sessions, etc.). The monitoring of recovery in this way can be helpful to understand how the body handles or absorbs the training load, different intensity blocks, or training phases. In addition, these recovery monitoring tools described below can identify possible benefits between different training interventions or protocols, as well as recovery strategies, giving us further insight to how our body performs on a day-to-day basis.
In what ways can we monitor recovery?
A measurement growing popularity called heart rate variability (HRV) can identify different types of fatigue with a simple measurement by first laying down (supine) followed by standing (orthostatic), however it has a more complex analysis. There are four main types of fatigue that have been well identified and studied of which different characteristics are present in the low frequency (sympathetic activity) and high frequency (parasympathetic activity) signals derived from the measurement (Schmitt et al., 2013 and 2015). These same researchers have developed and are finalizing a phone application which will soon be available including this research knowledge to make it available for practical use and analysis. For HRV measurements, it is important to have a good quality watch which can record the signal of the R-R interval with beat by beat measurement and high precision. Preferred examples of sufficient heart rate monitors include several models of Suunto, and those of Polar such as the S810, RS800, and newer (V800, H6, H7, and H10).
For practicality and feasibility in analysis, instead of a HRV measurement, we can perform a simple multi-purpose protocol ourselves to measure heart rate and assess recovery. This method incorporates lying rest, light exercise, and standing rest to provide insight on general fitness and give indications of neural recovery as well as fatigue level.
Recommended protocol as follows:
- Wake up (first get up to go to the bathroom if you need to void), put your heart rate monitor on, and find a quiet and undisturbed place that is warm and comfortable
- Lay down and rest – 1 minute to settle down and stabilize your heart rate
- Stay there continuing to lay down and rest – RECORD the average of 1 min
- Stand up and remain calm at standing rest – 1 minute
- Perform a light exercise of leg squats for 1 minute (at a speed of 1 second up and 1 second down to equal about 30 squats, be consistent in your knee angle aiming for 90°) and RECORD your average heart rate during this minute
- Stop exercise and stand calm for 1 minute (with the aim to reduce variability in your heart rate during the resting measurement which follows)
- Lay down and settle into a rest for at least 2-3 minutes allowing improved variability in the signaling (choose an amount of time here and keep consistent in your day to day measurement), RECORD the average of the last minute
- Write the average heart rates on paper or in an excel document. It is common to simply put your heart rate monitor on and then record a file with multiple laps for taking an average for facilitating each step of this measurement. You can then simply look back at the data to record on paper or computer thereafter (1 – average of last minute of lying rest; 2 – average of standing minute; 3 – average of light exercise minute; 4 – average of standing minute post-exercise; 5 – average of last minute of post-exercise lying rest). A tip is to also include a place for yourself to make daily comments about your general feelings to help guide your perceptions and inform your coach with discussion over your test values and associated feelings
Calculate your test value with the following equation using the average heart rates of the 3 recordings (1 = lying rest, 3 = light exercise, 5 = post-exercise lying rest):
Value = [(1 + 3 + 5) – HR max]
If you do not know your heart rate (HR) max, then use the equation: 220 – age = HR max
NOTE: The test value will be lower when you are recovered (i.e., before interval day) and higher when you are not well recovered (i.e., day after interval day or before easy day). This value has a range of both negative and positive values, as it is relative to your individual heart rate.
* Incorporating the use of a pulse oxygen saturation finger meter can be helpful to record in addition for further insight to your recovery and variation therein (especially when living or training at altitude).
At least 2 weeks of baseline measurements are needed to create a basis of understanding your values and to give an idea of how to adjust your training. This testing can begin anytime during the year and it is most helpful before adjusting your training for different phases and interventions. It is most applicable in spring, summer, and preparation phases while can also be key during travel and in-season between races, etc. From personal experience, it may be difficult to adapt and know this information on race day due to a psychological impact (though should be addressed individually).
The different phases of the above test have multiple intentions: the resting heart rate provides indication of general fitness and overall health (Reimers et al., 2018), the standing/orthostatic heart rate gives further insight to general fitness and also neural recovery, a modified Ruffier Index (test value) offers a fatigue and recovery marker to adjust exercise/training, and post-exercise resting heart rate gives insight to the recovery rate and active recovery response. Furthermore, the rate in which our body recovers from exercise (even if monitored after light squat exercise during lying rest) indicates the recovery of the parasympathetic nervous system (PNS), an autonomic control system of our body which is responsible for regulating our resting state by reducing both heart rate and respiration frequency as well as improving digestion. Research shows that reactivation of the parasympathetic nervous system begins within the 1stminute after stopping exercise and further continues for about 10 minutes after exercise (Michael et al., 2017). This reactivation of the PNS is dependent on exercise intensity and involves the combination of gradual metabolite clearance (decreased metaboreflex input), reduction of circulating catecholamines (hormones such as dopamine, adrenaline, and noradrenaline which are released due to emotional or physical stress from “fight or flight” response), and possible alterations of thermoregulatory factors such as blood flow redistribution (Michael et al., 2017). Therefore, the rate of recovery (measured by heart rate) post-exercise signifies the body’s ability to return to a homeostatic and balanced resting state. In general, the quicker the slowing of heart rate occurs after exercise, the less fatigue present in the body.
Heart rate signals are quite sensitive and variable as our cardiac function is regulated heavily by breath (respiratory sinus arrhythmia). Inhalation reduces intrathoracic pressure and facilitates venous return, i.e., the passage of blood from the veins of our limbs to our chest, which increases heart rate. Thus, increasing blood pressure which results in the stretching of baroreceptors (regulatory mechanism of the body to maintain balance in blood pressure), then potentiation/increase of parasympathetic activity in the brain stem, followed by exhalation (slowing of the heart rate).
Altogether, monitoring recovery daily via a simple morning heart rate assessment as outlined above provides a great opportunity to learn about your body’s signals and how training and recovery affects your overall wellbeing. This protocol offers multiple indicators (resting heart rate, orthostatic heart rate, recovery/fatigue index, and post-exercise resting heart rate) to guide adjusting your lifestyle and training sessions to improve your performance.
References
1. Personal experiences combined with expertise from Bryan Fish (testing we have done together by introducing similar recovery monitoring to the CXC Development team) and Andy Newell (previously shared on the Nordic Team Solutions resources)
2. Schmitt, L., Regnard, J., Desmarets, M., Mauny, F., Mourot, L., Fouillot, J.P., Coulmy, N., Millet, G.P. (2013). Fatigue shifts and scatters heart rate variability in elite endurance athletes. Plos Onehttps://doi.org/10.1371/journal.pone.0071588
3. Schmitt, L., Regnard, J., Paramentier, A.L., Mauny, F., Mourot, L., Coulmy, N., Millet, G.P. (2015). Typology of «Fatigue» by heart rate variability analysis in elite Nordic skiers. Int J Sports Med 36(12): 999-1007
4. Reimers, A. K., Knapp, G., & Reimers, C. D. (2018) Effects of Exercise on the Resting Heart Rate: A Systematic Review and Meta-Analysis of Interventional Studies. Journal of clinical medicine, 7(12), 503. https://doi.org/10.3390/jcm7120503
5. Michael, S., Graham, K.S., Davis G.M. (2017) Cardiac Autonomic Responses during Exercise and Post-exercise Recovery Using Heart Rate Variability and Systolic Time Intervals—A Review Front. Physiol. 29